
Faceoffs and Possession: A Win Does Not Describe the Whole Game
Faceoff percentage describes puck drops after stoppages, not the full sequence of control. See a formula, example, and limits for team and player markets.
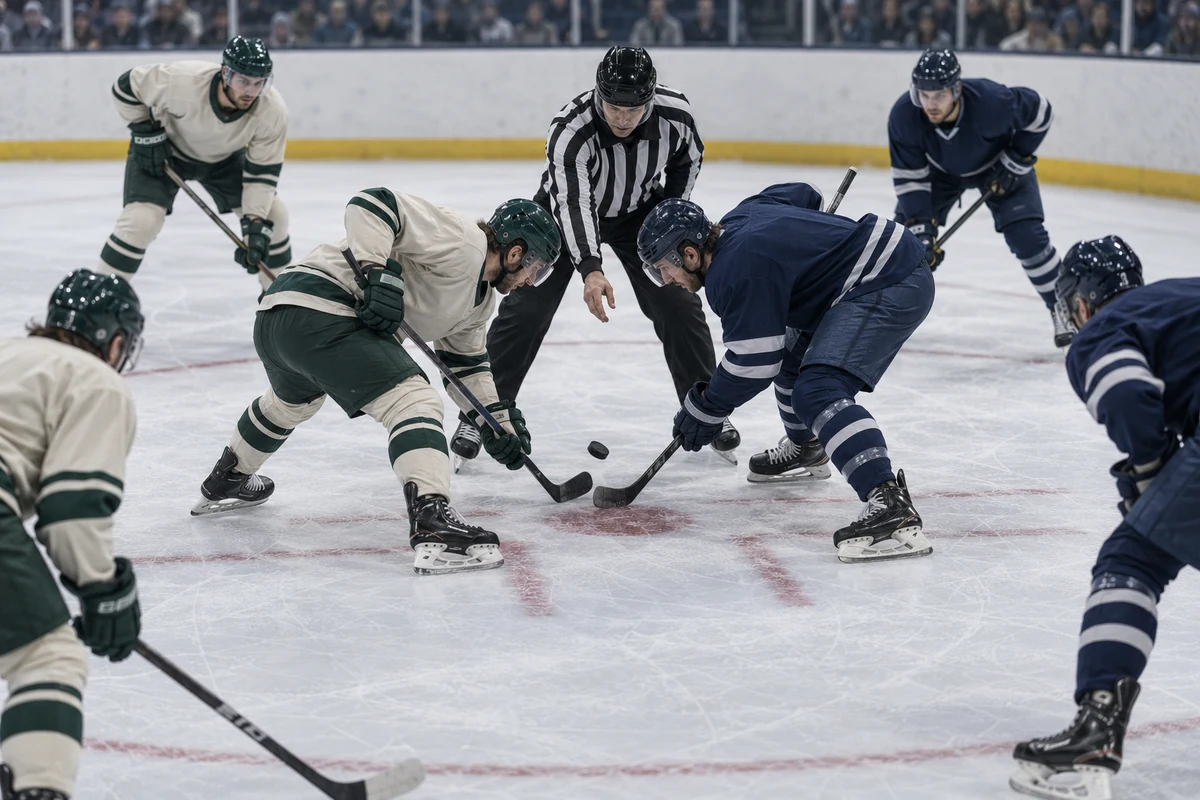
A faceoff win is only the start of a play
Faceoff percentage shows how often a team or player won a puck drop in the recorded sample. It is commonly calculated as wins divided by the counted draws in that view. That describes starts after stoppages; it is not a measure of continuous puck control across the game.
After a nominal faceoff win, the puck can go to the opponent, remain loose, or be cleared from the zone. The center who wins the draw does not guarantee that a teammate controls the puck next. Faceoff percentage should therefore not be read as possession share or direct attacking pressure.
A simple example
A team wins 10 of 16 draws: 10 / 16 = 62.5%. In a teaching observation of those ten wins, it keeps immediate puck control in six cases; in four others, a loose-puck contest starts or the opponent gains control. This shows the difference between the draw result and the next game state. Six of ten is only an illustrative tag in this example, not an official statistic or universal possession definition.
Results also depend on faceoff zone, side of the rink, lineup, and opponent strength. A defensive-zone win may help the team start an exit; an offensive-zone win creates a chance to shoot, but the team still has to retain the puck. Zone and game-state splits are more informative than one overall rate when the source provides them.
Possession needs a separate definition
To describe control after a faceoff, you need to define who recovered the puck and for how long. That is a separate event framework: one might track first touch, a zone exit, the next shot attempt, or control until a turnover. Public tables may not share one short definition. State the rule and apply it consistently to both teams.
Draws can matter on power plays and penalty kills, when a win may establish an immediate setup. But what follows depends on passes, attempts, blocks, and saves. Our guide to hockey power plays and penalty kills explains that context. For the resulting shot count, check what counts as a shot on goal.
Applying it to a market
For an individual faceoff-wins market, check whether the player is expected to take draws, the number of opportunities, zone, and opponent—not just his overall percentage. For a team goals or shots total, faceoff% is only an initial condition. It does not tell you whether a shot follows, whether the puck stays in the zone, or how the team uses the sequence.
Compare players over similar minutes and account for lineups. Do not extrapolate from a handful of games: a small number of draws can move the percentage quickly.
Before drawing a conclusion, verify the denominator, zone, and manpower state. If a table shows only wins and losses, call it a faceoff statistic—not possession across the rest of the sequence.