
Volleyball Attack Efficiency: Points, Errors, and All Attempts
A formula subtracts attack errors from points across all attempts. See how attack-point rate differs from net efficiency.
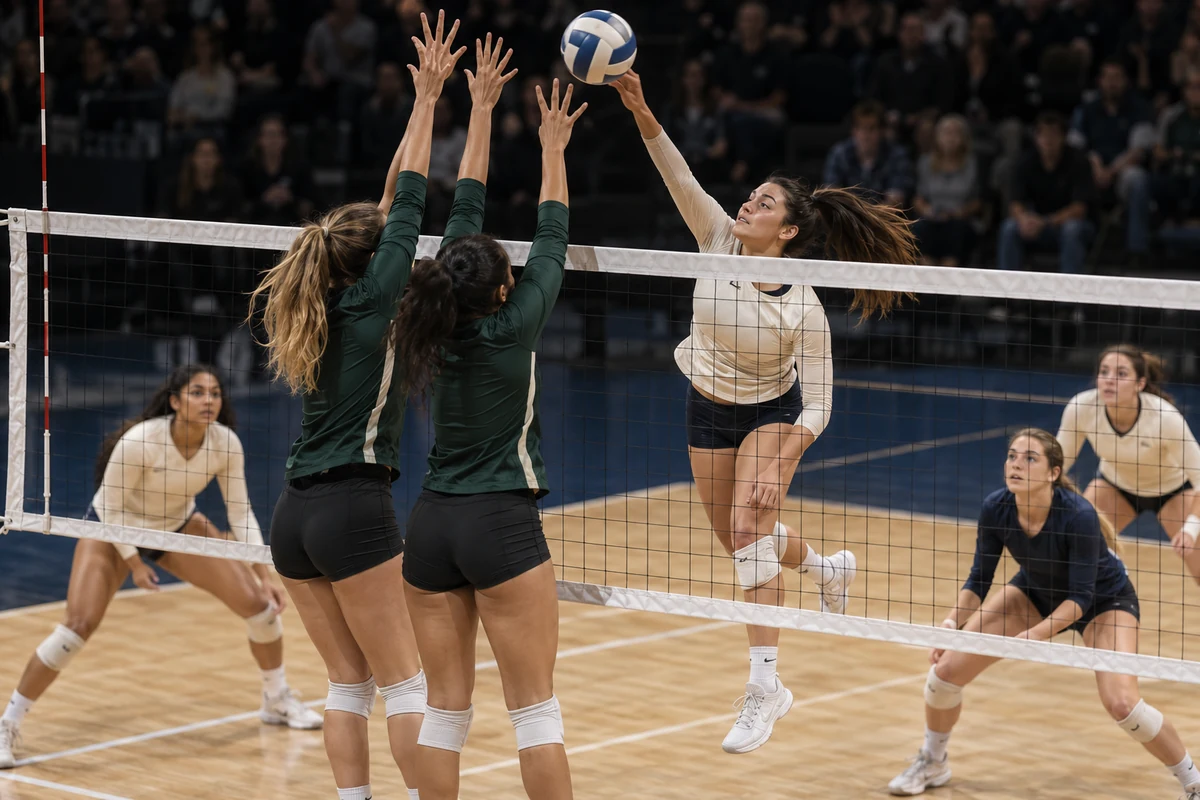
What attack efficiency captures
A volleyball attack can score a point, end in an error, or keep the rally going. A kill percentage counts only successful attacks, so it does not penalize errors. One common efficiency measure uses the net result: attack points minus errors, divided by all attack attempts.
This article uses the formula attack efficiency = (AttackPoint − AttackFault) / AttackTotalAttempts × 100%. Attempts include attacks that score, end in a fault, or continue the rally. If a block ends the attack and gives the opponents a point, that event is coded as an attacking fault; if the ball stays live after the block, the attempt is coded as continuing. Check the competition’s event-coding rules for blocks and attacks before comparing reports.
A worked calculation
A hitter scores 22 attack points, makes 5 errors, and takes 50 attacks. The attack-point rate is 22 / 50 = 44%; the error rate is 5 / 50 = 10%; net efficiency is (22 − 5) / 50 = 34%. Efficiency can be negative when errors outnumber points. That does not mean the player scored negative points; it means faults outweigh successful attacks in this formula.
The example shows why efficiency is not the same as the percentage of attacks won. Forty-four percent answers what share of attempts produced an attack point; 34% subtracts the cost of faults. Neither attempts nor net efficiency alone describes how well the whole team played in every rally.
Why context changes the comparison
Position and role matter: an opposite, middle blocker, and outside hitter receive different sets and face different defenses. A poor reception limits the setter’s options; a strong opposing block may force a hitter toward the edges or a tip. Compare players with attempt count, sets played, and opponent in mind. A short sample can swing sharply after a few errors or successful swings.
Team efficiency combines all hitters; an individual figure covers one player. Check whether a report includes back-row attacks and how it records blocked balls. Attack efficiency and a set-points total answer different questions: scoring rules and set scenarios are discussed in our guides to volleyball points per set and set totals.
What it adds to market analysis
For a player-points market, attack efficiency describes the balance between scoring swings and errors. To assess future volume, you also need expected role, starting lineup, number of sets, and reception quality. A percentage over ten attempts is not comparable to the same figure over fifty. A team result also depends on serve, block, transition attack, and opponent strength.
Do not interpret efficiency as a win probability or a guarantee that an average will repeat. Check the competition, scorekeeping method, and sample period.
Read also
Side-Out and Break Points: Two Ways to Win a Volleyball Rally