
Turnover Percentage: Why Raw Counts Depend on Pace
Separate turnover counts, pace, and turnover share. A simple calculation shows the limits for team and player markets.
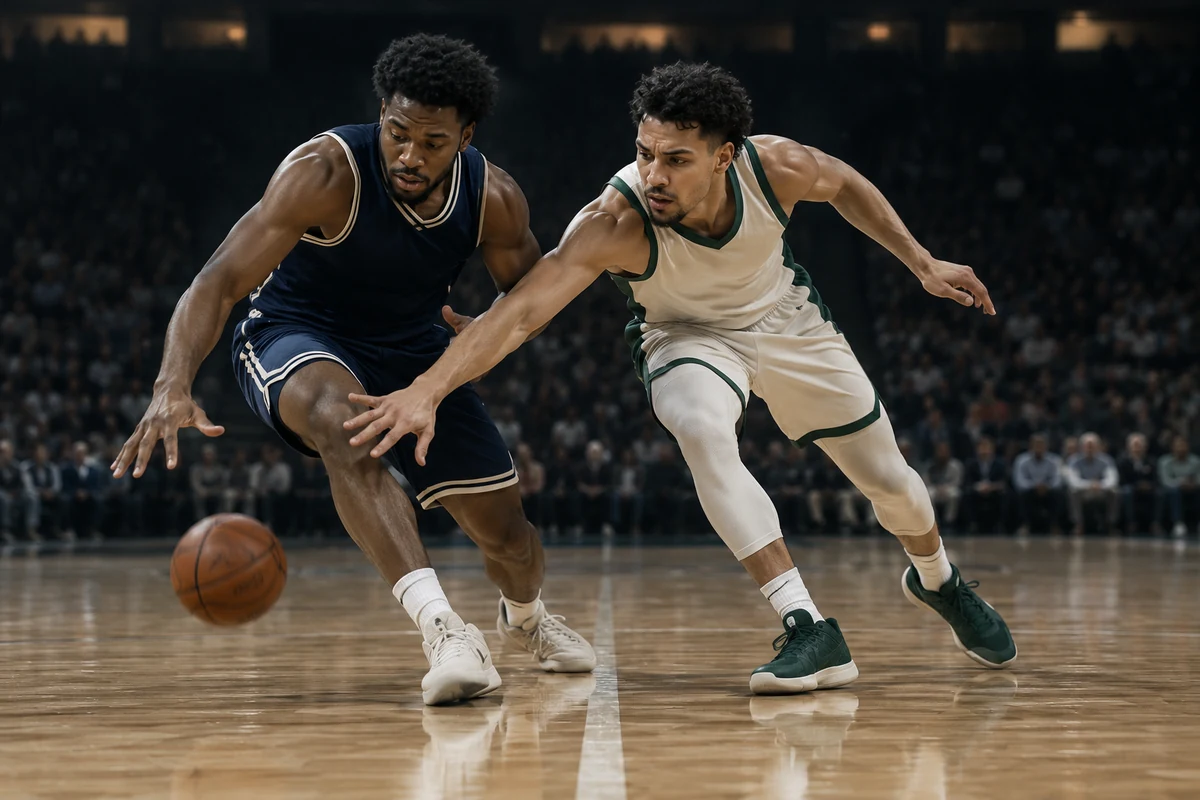
Why 12 turnovers are not a conclusion
A raw turnover total depends on how many attacks a team has, not just on how carefully it handles the ball. A fast-paced team gets more possessions and may record more turnovers even when the share of failed plays is unchanged. That is why analysts compare the count with pace and turnover percentage (TOV%), the share of plays that end in a turnover.
The official definition describes TOV% as the percentage of plays that end in a player’s or team’s turnover. Different tables can use different formulas and denominators for players and teams; do not transfer one formula to every report. In a game with four 12-minute quarters, pace is usually expressed as team possessions per 48 minutes; other competitions may use a different regulation length. It normalizes volume, not quality.
A simple calculation
Take two hypothetical teams over the same 48 minutes. Team A has 96 estimated possessions and 12 turnovers: the simplified share is 12 / 96 = 12.5%. Team B has 112 possessions and 14 turnovers: 14 / 112 is also 12.5%. Team B has more turnovers in raw count, but the rate relative to its number of attacks is the same.
This is illustrative arithmetic, not a universal official TOV% formula. A specific statistic may account for individual actions and playing time. Pace also depends on how possessions and game duration are estimated. Check the definitions, especially when comparing a team season table with an individual player row.
What pace changes—and what it does not
Faster basketball creates more potential shots, rebounds, and turnovers in a game. Pace does not say how often attacks end in mistakes or how many points a team scores. A low turnover count may come from fewer possessions rather than safer ball handling. For one game, overtime also changes the exposure: 48 minutes and 53 minutes are not equivalent samples.
Compare turnovers over a similar time window, with lineup, opponent pressure, and player roles in mind. A point guard losing the ball after a teammate’s injury faces a different situation from a player who rarely handles it. For player points, rebounds, and assists markets, consider how a turnover affects minutes and possession distribution; see our guide to combined player markets.
Using the metrics before assessing a line
For a game total, faster pace can create more events, but the final score also depends on shooting, free throws, offensive rebounds, and transition defense. For a player-turnover line, check ball-handling role, opponent, and expected playing time. Do not turn a team TOV% directly into an individual forecast or assume that one recent game defines the next matchup’s pace.
First verify that the periods and definitions match; then separate tempo from possession quality. Betting settlement after extra time can differ by market; our guide to basketball spreads and overtime discusses that separately.
TOV% describes the share of plays lost to turnovers; pace describes the number of possessions. Both add context, but neither determines a market result or removes the randomness of mistakes.
For a player, the denominator is generally tied to his own on-court plays rather than every team possession. A team rate of 12.5% therefore cannot be applied to an individual without more information. Compare statistics at the same level of aggregation.