
Usage vs. Touches: Player Involvement Is Not Efficiency
Separate possessions a player finishes from all ball touches. A simple example explains tracking limits and context for points or assist markets.
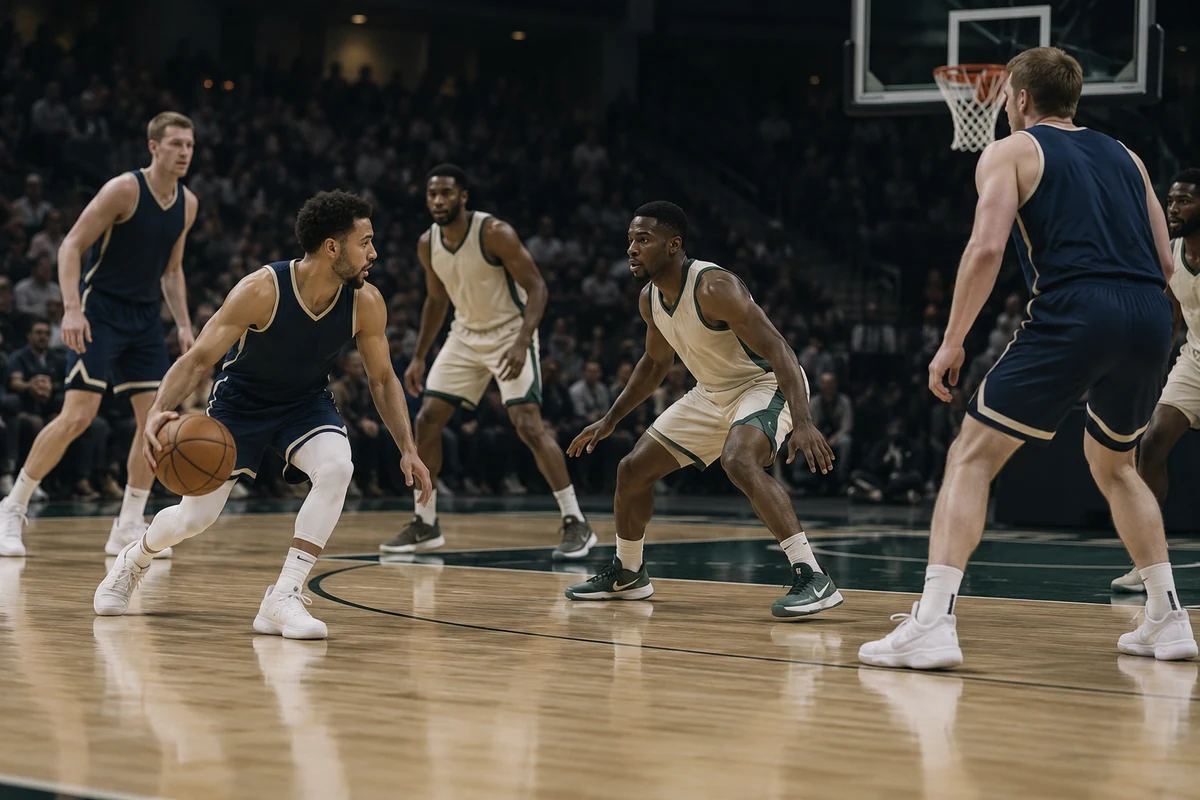
Two role measures, but not the same thing
Usage rate estimates the share of offensive plays a player uses through a field-goal attempt, turnover, or free-throw attempt. It is an estimate of used plays, not a count of unique possessions: an attack can continue after a miss through an offensive rebound. It measures involvement in finishing actions, not shot quality or every ball touch. Touches count ball contacts instead. A pass, a dribble used to organize the offense, or a brief catch may count as a touch even when the player does not end the possession.
The same touch count can come with different responsibility. A point guard who receives the ball early and makes passes may record many touches but a moderate usage rate. A player who receives the ball mainly to shoot may touch it less often yet finish many attacks.
A simplified example
In a teaching example, a team has 64 possessions while a player is on the floor, and 18 counted finishing actions are attributed to that player. The ratio 18 / 64 = 28.1% illustrates the scale of his involvement in endings. Suppose he also touches the ball 58 times in that span. The 58 describes how often he participates with the ball; it is not the usage denominator or a share of possessions.
This is illustrative arithmetic, not a reproduction of a particular data provider’s formula. Published tables may normalize for minutes and team pace, while touch counts depend on tracking definitions. Check the field definitions, time period, and units before comparing. High usage does not automatically mean high scoring; it can come with turnovers or poor shooting.
What to check in a comparison
Read usage and touches alongside minutes, starting status, assists, and turnovers. If a player gets more time without the primary ball handler, he may receive more touches and finish more possessions. When a teammate returns, those roles can change. A season average does not automatically describe the current lineup.
Touches require tracking data and may be unavailable for some leagues or games. A sample of a few contests is especially vulnerable to injuries, a lopsided score, and a short shooting streak. For points or assists markets, check the actual opportunities behind each statistic rather than relying on a label. Our guide to PRA: points, rebounds, and assists offers broader player-market context.
Applying the distinction to a market
Before assessing a points total, ask whether the player is likely to finish more possessions, create more assists, or simply handle the ball more often. Those are different scenarios and do not always move box-score outcomes in the same direction. More touches accompanied by more turnovers may not raise a points estimate. Check lineup, expected minutes, and the line separately.
For team markets, one player’s role is only part of the picture; pace, opponent, and other players still matter. Settlement rules that include extra time are a separate issue, covered in our guide to basketball spreads and overtime.
Usage asks, “Who uses plays for a finishing action?” Touches ask, “Who handles the ball, and how often?” Neither number automatically measures efficiency or turns a line into a confident forecast.
A field-goal attempt does not necessarily end the team’s possession: a teammate can rebound a miss and continue the attack. “Used play” is therefore more precise than a literal possession count. Check the chosen table’s documentation and compare like-for-like game segments.