
Post-Shot xG: What Shot Placement Says About Goalkeeping
Post-shot xG estimates the chance of a goal after a shot, using its placement. Learn how it differs from pre-shot xG and what it cannot prove about a goalkeeper.
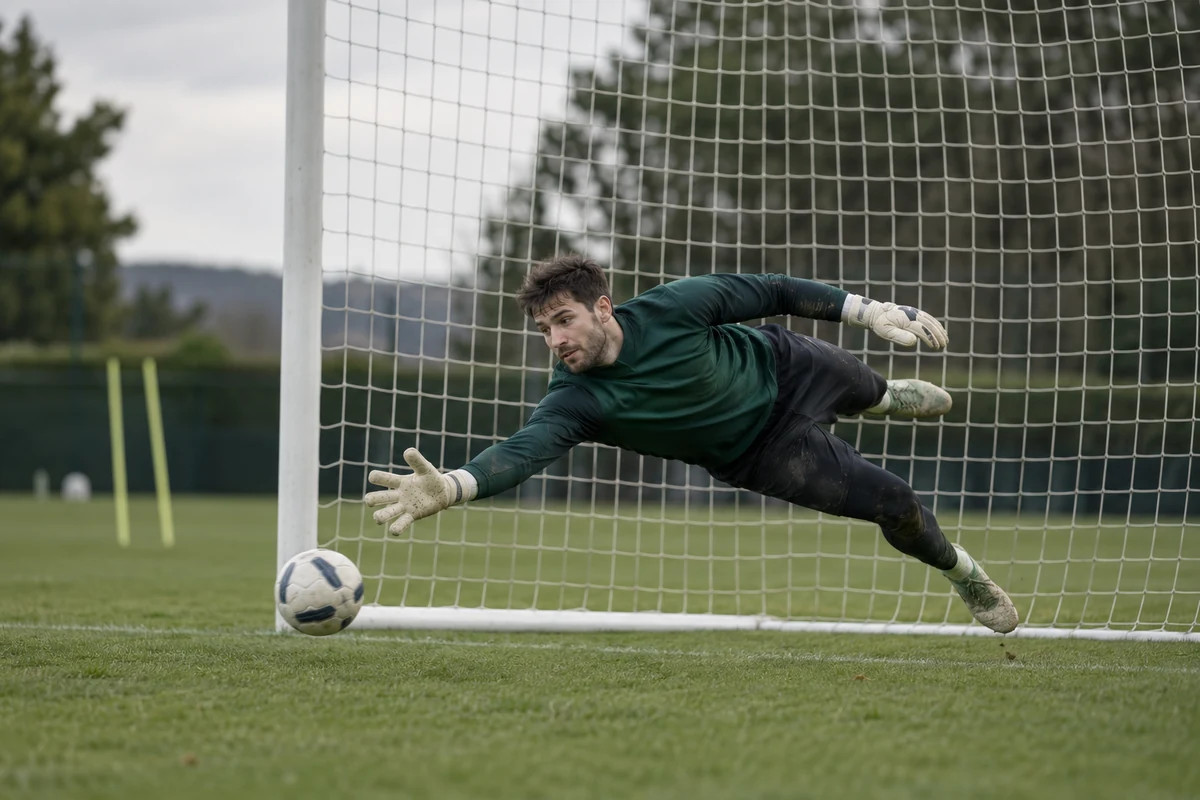
Before the shot and after it are different questions
Ordinary xG estimates the chance of a goal at the moment of the shot using information about the chance: location, angle, body part and other model features. Post-shot xG (PSxG, sometimes xGOT) uses additional information that exists only after the shot, especially its direction and placement on target; some models also include goalkeeper position or shot speed.
That distinction matters. Pre-shot xG describes the chance before execution; post-shot xG describes the shot after it has been directed. Goalkeeper analysis therefore often looks at shots on target and asks how difficult they were under the chosen model. Do not substitute PSxG for ordinary xG: they have different timing and inputs. The xGA guide covers a team’s pre-shot expected goals conceded.
An illustrative calculation
Suppose a goalkeeper faces two on-target shots with hypothetical PSxG values of 0.30 and 0.60. Their sum is 0.90—roughly one model-expected goal across those attempts if each value is interpreted as a shot-level probability. If both are saved, the observed number conceded is lower than this model expected in the example. But do not turn 0.90 into a universal “goals saved above expectation” formula: systems can differ in included attempts, rounding, definitions and aggregation.
The metric describes past shots, not pure goalkeeper talent. Observed differences also reflect sample size, shot types and quality, deflections, defenders, sightlines, positioning, speed and which attempts count as on target. Two goalkeepers with the same goals conceded can have different PSxG faced because they saw different shots.
How to read the metric without overclaiming
Check which version is used; whether it includes only shots on target; how penalties, rebounds and deflections are treated; the period covered; and how minutes and shot counts are normalized. Review the distribution of attempts and video context instead of relying only on a ranking. For save-rate statistics, understand the denominator too; the save rate versus shot quality guide explains why one percentage can mislead.
Implications for analysis and betting
A high PSxG faced indicates that on-target attempts were difficult under the selected model; to assess saves, compare it with goals actually conceded and recorded saves. It does not promise that the form will continue or prove that the next match will have fewer goals. A pre-match market also depends on defensive style, areas conceded, lineup and available prices; do not use a post-shot measure as if it had been known before the shot.
Keep pre-shot and post-shot values separate, along with snapshot date, source, period and shot count. Do not merge club or league figures from different metric versions without checking definitions. PSxG is an additional analytical layer, not a standalone recommendation.
Read also
Sportexa AI
Apply this to a real match
Choose a match in Sportexa AI and ask the assistant how the available sports data and current odds relate to the idea in this article.
Open the assistant